Perfection Kills

by kangax

Exploring Javascript by example

Profiling CSS for fun and profit. Optimization notes.

January 4th, 2012

I’ve been recently working on optimizing performance of a so-called one-page web app. The application was highly dynamic, interactive, and was heavily stuffed with new CSS3 goodness. I’m not talking just border-radius and gradients. It was a full stack of shadows, gradients, transforms, sprinkled with transitions, smooth half-transparent colors, clever pseudo-element -based CSS tricks, and experimental CSS features.

Aside from looking into bottlenecks on Javascript/DOM side, I decided to step into the CSS land. I wanted to see the kind of impact these nice UI elements have on performance. The old version of the app — the one without all the fluff — was much snappier, even though the JS logic behind it hasn’t changed all that drastically. I could see by scrolling and animations that things are just not as quick as they should be.

Was styling to blame?

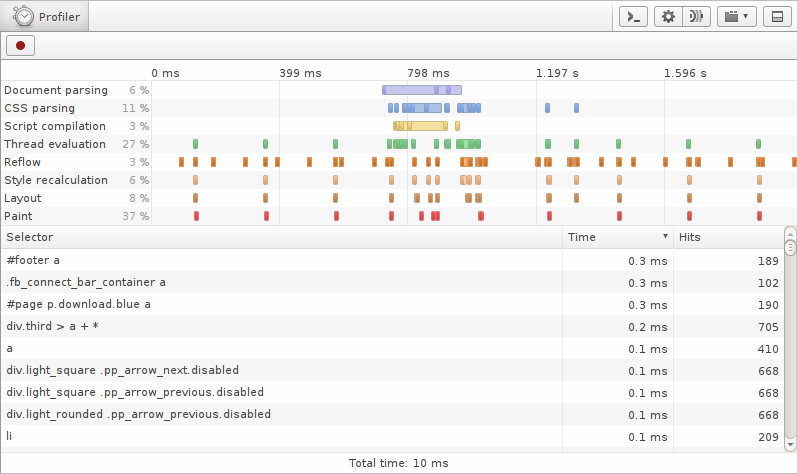
Fortunately, just few days before, Opera folks came out with an experimental “style profiler” (followed by WebKit’s ticket+patch shortly after). The profiler was meant to reveal the performance of CSS selector matching, document reflow, repaint, and even document and css parsing times.

Perfect!

I wasn’t thrilled about profiling in one environment, and optimizing according to one engine (especially the engine that’s used only in one browser), but decided to give it a try. After all, the offending styles/rules would probably be similar in all engines/browsers. And this was pretty much the only thing out there.

The only other somewhat similar tool was WebKit’s “timeline” tab in Developer Tools. But timeline wasn’t very friendly to work with. It wouldn’t show total time of reflow/repaint/selector matching, and the only way to extract that information was by exporting data as json and parsing it manually (I’ll get to that later).

Below are some of my observations from profiling using both WebKit and Opera tools. TL;DR version is at the end.

Before we start, I’d like to mention that most (if not all) of these notes apply best to large, complex applications. Documents that have thousands of elements and that are highly interactive will benefit the most. In my case, I reduced page load time by ~650ms (~500ms (!) on style recalculation alone, ~100ms on repaint, and ~50ms on reflow). The application became noticeably snappier, especially in older browsers like IE7.

For simpler pages/apps, there are plenty of other optimizations that should be looked into first.

Notes

  1. The fastest rule is the one that doesn’t exist. There’s a common strategy to combine stylesheet “modules” into one file for production. This makes for one big collection of rules, where some (lots) of them are likely not used by particular part of the site/application. Getting rid of unused rules is one of the best things your can do to optimize CSS performance, as there’s less matching to be done in the first place. There are certain benefits of having one big file, of course, such as the reduced number of requests. But it should be possible to optimize at least critical parts of the app, by including only relevant styles.

    This isn’t a new discovery by any means. Page Speed has always been warning against this. However, I was really surprised to see just how much this could really affect the rendering time. In my case, I shaved ~200-300ms of selector matching — according to Opera profiler — just by getting rid of unused CSS rules. Layout and paint times went down as well.

  2. Reducing reflows — another well-known optimization — plays big role here as well. Expensive styles are not so expensive when fewer reflows/repaints need to be performed by the browser. And even simple styles could slow things down if they’re applied a lot. Reducing reflows AND reducing complexity of CSS go hand in hand.

  3. Most expensive selectors tend to be universal ones ("*"), and those with multiple classes (".foo.bar", "foo .bar.baz qux", etc.). We already knew this, but it’s nice to get confirmation from profilers.

  4. Watch out for universal selectors ("*") that are used for “no reason”. I found selectors like "button > *", even though throughout the site/app buttons only had <span>’s in them. Replacing "button > *" with "button > span" made for some amazing improvements in selector performance. The browser no longer needs to match every element (due to right-left matching). It only needs to walk over <span>’s — the number of which could be significantly smaller — and check if parent element is <button>. You obviously need to be careful substituting "*" with specific tags, as it’s often hard to find all the places where this selector could be used.

    The big downside of this optimization is that you lose flexibility, as changing markup will now require changing CSS as well. You won’t be able to just replace one button implementation with another one in the future. I felt iffy doing this replacement, as it’s essentially getting rid of useful abstraction for the sake of performance. As always, find the right compromise for your particular case, until engines start to optimize such selectors and we don’t have to worry about them.

  5. I used this snippet to quickly find which elements to substitute "*" with.

    
    $$(selector).pluck('tagName').uniq(); // ["SPAN"]

    This relies on Array#pluck and Array#uniq extensions from Prototype.js. For plain version (with reliance on ES5 and selectors API), perhaps something like this would do:

    
    Object.keys([].slice.call(
      document.querySelectorAll('button > *'))
        .reduce(function(memo, el){ memo[el.tagName] = 1; return memo; }, {}));
    
  6. In both Opera and WebKit, [type="..."] selectors seem to be more expensive than input[type="..."]. Probably due to browsers limiting attribute check to elements of specified tag (after all, [type="..."] IS a universal selector).

  7. In Opera, pseudo "::selection" and ":active" are also among more expensive selectors — according to profiler. I can understand ":active" being expensive, but not sure why "::selection" is. Perhaps a “bug” in Opera’s profiler/matcher. Or just the way engine works.

  8. In both Opera and WebKit, "border-radius" is among the most expensive CSS properties to affect rendering time. Even more than shadows and gradients. Note that it doesn’t affect layout time — as one would think — but mainly repaint.

    As you can see from this test page, I created a document with 400 buttons.

    Buttons

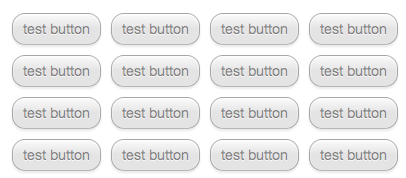
    I started checking how various styles affect rendering performance (“repaint time” in profiler). The basic version of button only had these styles:

    
    background: #F6F6F6;
    border: 1px solid rgba(0, 0, 0, 0.3);
    font-family: 'Helvetica Neue', Helvetica, Arial, sans-serif;
    font-size: 14px;
    height: 32px;
    vertical-align: middle;
    padding: 7px 10px;
    float: left;
    margin: 5px;
    

    Btn Before

    The total repaint time of 400 buttons with these basic styles only took 6ms (in Opera). I then gradually added more styles, and recorded change in repaint time. The final version had these additional styles, and was taking 177ms to repaint — a 30x increase!

    
    text-shadow: rgba(255, 255, 255, 0.796875) 0px 1px 0px;
    box-shadow: rgb(255, 255, 255) 0px 1px 1px 0px inset, rgba(0, 0, 0, 0.0976563) 0px 2px 3px 0px;
    border-radius: 13px;
    background: -o-linear-gradient(bottom, #E0E0E0 50%, #FAFAFA 100%);
    opacity: 0.9;
    color: rgba(0,0,0,0.5);
    

    Btn After

    The exact breakdown of each one of those properties was as follows:

    The text-shadow and linear-gradient were among the least expensive ones. Opacity and transparent rgba() color were a little more expensive. Then there was box-shadow, with inset one (0 1px 1px 0) slightly faster than regular one (0 2px 3px 0). Finally, the unexpectedly high border-radius.

    I also tried transform with rotate parameter (just 1deg) and got really high numbers. Scrolling the page — with 400 slightly rotated buttons on it — was also noticeably jerky. I’m sure it’s not easy to arbitrarily transform an element on a page. Or maybe this is the case of lack of optimization? Out of curiosity, I checked different degrees of rotation and got this:

    Note how even rotating element by 0.01 degree is very expensive. And as the angle increases, the performance seems to drop, although not linearly but apparently in a wavy fashion (peaking at 45deg, then falling at 90deg).

    There’s room for so many tests here — I’d be curious to see performance characteristics of various transform options (translate, scale, skew, etc.) in various browsers.

  9. In Opera, page zoom level affects layout performance. Decreasing zoom increases rendering time. This is quite understandable, as more stuff has to be rendered per same area. It might seem like an insignificant detail, but in order to keep tests consistent, it’s important to make sure zoom level doesn’t mess up your calculations. I had to redo all my tests after discovering this, just to make sure I’m not comparing oranges to grapefruits.

    Speaking of zoom, it could make sense to test decreased font and see how it affects overall performance of an app — is it still usable?

  10. In Opera, resizing browser window doesn’t affect rendering performance. It looks like layout/paint/style calculations are not affected by window size.

  11. In Chrome, resizing browser window does affect performance. Perhaps Chrome is smarter than Opera, and only renders visible areas.

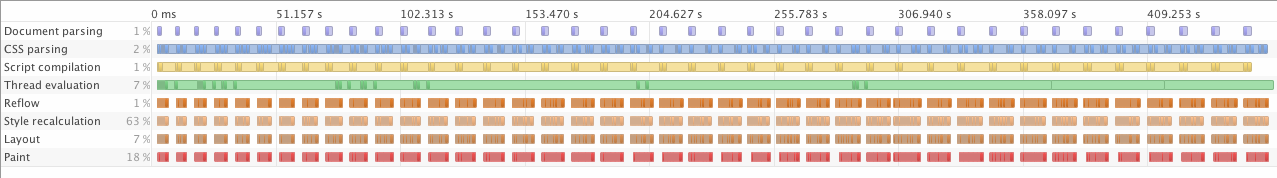
  12. In Opera, page reloads negatively affect performance. The progression is visibly linear. You can see from the graph how rendering time slowly increases over 40 page reloads (each one of those red rectangles on the bottom correspond to page load followed by few second wait). Paint time becomes almost 3 times slower at the end. It looks almost like page is leaking. To err on a side of caution, I always used the average of first ~5 results to get “fresh” numbers.

    Profiler Page Reload

    Script used for testing (reloading page):

    
    window.onload = function() {
      setTimeout(function() {
        var match = location.href.match(/\?(\d+)$/);
        var index = match ? parseInt(match[1]) : 0;
        var numReloads = 10;
        index++;
        if (index < numReloads) {
          location.href = location.href.replace(/\?\d+$/, '') + '?' + index;
        }
      }, 5000);
    };
    

    I haven’t checked if page reloads affect performance in WebKit/Chrome.

  13. An interesting offending pattern I came across was a SASS chunk like this:

    
    a.remove > * {
      /* some styles */
      .ie7 & {
        margin-right: 0.25em;
      }
    }
    

    ..which would generate CSS like this:

    
    a.remove > * { /* some styles */ }
    .ie7 a.remove > * { margin-right: 0.25em }
    

    Notice the additional IE7 selector, and how it has a universal rule. We know that universal rules are slow due to right-left matching, and so all browsers except IE7 (which .ie7 — probably on <body> element — is supposed to target) are taking an unnecessary performance hit. This is obviously the worst case of IE7-targeted selector.

    Other ones were more innocent:

    
    .steps {
      li {
        /* some styles */
        .ie7 & {
          zoom: 1;
        }
      }
    }
    

    ..which produces CSS like:

    
    .steps li { /* some styles */ }
    .ie7 .steps li { zoom: 1 }
    

    But even in this case engine needs to check each <li> element (that’s within element with class “steps”) until it would “realize” that there’s no element with “ie7” class further up the tree.

    In my case, there was close to a hundred of such .ie7 and .ie8 -based selectors in a final stylesheet. Some of them were universal. The fix was simple — move all IE-related styles to a separate stylesheet, included via conditional comments. As a result, there were that many less selectors to parse, match and apply.

    Unfortunately, this kind of optimization comes with a price. I find that putting IE-related styles next to the original ones is actually a more maintainable solution. When changing/adding/removing something in the future, there’s only one place to change and so there’s less chance to forget IE-related fixes. Perhaps in the future tools like SASS could optimize declarations like these out of the main file and into conditionally-included ones.

  14. In Chrome (and WebKit), you can use “Timeline” tab in Developer tools to get similar information about repaint/reflow/style recalculation performance. Timeline tab allows you to export data as JSON. First time I’ve seen this done was by Marcel Duran in this year’s Performance Calendar. Marcel used node.js and a script to parse and extract data.

    Unfortunately, his script was including “Recalculate styles” time in the “layout” time — something I wanted to avoid. I also wanted to avoid page reloads (and getting average/median time). So I tweaked it to a much simpler version. It walks over entire data, filtering entries related to Repaint, Layout, and Style Calculation; then sums up total time for each of those entries:

    
    var LOGS = './logs/',
        fs = require('fs'),
        files =  fs.readdirSync(LOGS);
    
    files.forEach(function (file, index) {
      var content = fs.readFileSync(LOGS + file),
          log,
          times = {
            Layout: 0,
            RecalculateStyles: 0,
            Paint: 0
          };
    
      try {
        log = JSON.parse(content);
      }
      catch(err) {
        console.log('Error parsing', file, ' ', err.message);
      }
      if (!log || !log.length) return;
    
      log.forEach(function (item) {
        if (item.type in times) {
          times[item.type] += item.endTime - item.startTime;
        }
      });
    
      console.log('\nStats for', file);
      console.log('\n  Layout\t\t', times.Layout.toFixed(2), 'ms');
      console.log('  Recalculate Styles\t', times.RecalculateStyles.toFixed(2), 'ms');
      console.log('  Paint\t\t\t', times.Paint.toFixed(2), 'ms\n');
      console.log('  Total\t\t\t', (times.Layout + times.RecalculateStyles + times.Paint).toFixed(2), 'ms\n');
    });
    

    After saving timeline data and running a script, you would get information like this:

    
    Layout                      6.64 ms
    Recalculate Styles          0.00 ms
    Paint                       114.69 ms
    
    Total                       121.33 ms
    

    Using Chrome’s “Timeline” and this script, I ran original button test that I tested before in Opera and got this:

    Similarly to Opera, border-radius was among least performant. However, linear-gradient was comparatively more expensive than that in Opera and box-shadow was much higher than text-shadow.

    One thing to note about Timeline is that it only provides “Layout” information, whereas Opera’s profiler has “Reflow” AND “Layout”. I’m not sure if reflow data analogous to Opera’s is included in WebKit’s “Layout” or if it’s discarded. Something to find out in the future, in order to have correct testing results.

  15. When I was almost done with my findings, WebKit has added selector profiler similar to Opera’s one.

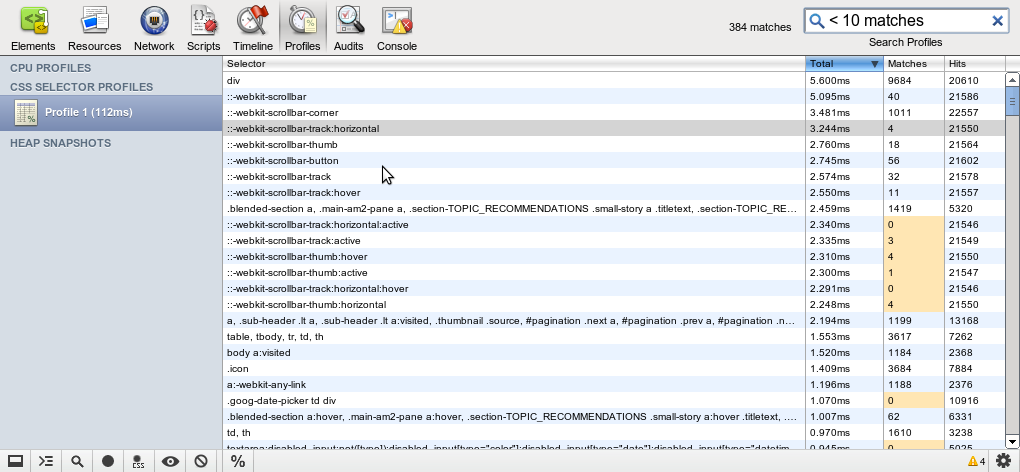
    I wasn’t able to do many tests with it, but noticed one interesting thing. Selector matching in WebKit was marginally faster than that of Opera. The same document — that one-page app I was working on (before optimizations) — took 1,144ms on selector matching in Opera, and only 18ms in WebKit. That’s a ~65x difference. Either something is off in calculations of one of the engines, or WebKit is really much much faster at selector matching. For what it’s worth, Chrome’s timeline was showing ~37ms for total style recalculation (much closer to WebKit), and ~52ms for repaint (compare to Opera’s 225ms “Paint” total; different but much closer). I wasn’t able to save “Timeline” data in WebKit, so couldn’t check reflow and repaint numbers there.

Summary

  • Reduce total number of selectors (including IE-related styles: .ie7 .foo .bar)
  • Avoid universal selectors (including unqualified attribute selectors: [type="url"])
  • Page zoom affects CSS performance in some browsers (e.g. Opera)
  • Window size affects CSS performance in some browsers (e.g. Chrome)
  • Page reloads can negatively affect CSS performance in some browsers (e.g. Opera)
  • “border-radius” and “transform” are among most expensive properties (in at least WebKit & Opera)
  • “Timeline” tab in WebKit-based browsers can shed light on total recalc/reflow/repaint times
  • Selector matching is much faster in WebKit

Questions

As I end these notes, I have tons of other questions related to CSS performance:

  • Quoted attribute values vs. unquoted ones (e.g. [type=search] vs [type="search"]). How does this affect performance of selector matching?
  • What are the performance characteristics of multiple box-shadows/text-shadows/backgrounds? 1 text-shadow vs. 3 vs. 5.
  • Performance of pseudo selectors (:before, :after).
  • How do different border-radius values affect performance? Is higher radius more expensive? Does it grow linearly?
  • Does !important declaration influence performance? How?
  • Does hardware acceleration influence performance? How?
  • Are styles similarly expensive in different combinations? (e.g. text-shadow with linear-gradient vs. text-shadow on one-color background)

Future

As our pages/apps become more interactive, the complexity of CSS increases, and browsers start to support more and more “advanced” CSS features, CSS performance will probably become even more important. The existing tools are only scratching the surface. We need the ones for mobile testing and tools in more browsers (IE, Firefox). I created a ticket for Mozilla, so perhaps we’ll see something come out of it soon. I would love to see CSS performance data exposed via scripting, so that we could utilize it in tools like jsperf.com (cssperf.com?). Meanwhile, there’s plenty of tests to be done with existing profilers. So what are you waiting for? ;)

Categories: benchmark, css

Comments (73)

  1. Gravatar

    Nicholas C. Zakas said on Jan 4, 2012 @ 12:28

    Nice work, this is great information. CSS Lint currently warns you about empty rules and the * selector, and I’m going to try to get in more rules based on this research. Thanks for the detailed post.

  2. Gravatar

    Paul Miller said on Jan 4, 2012 @ 12:37

    Very interesting article, thanks kangax.

    Had you tested performance of nested selectors (.a .b .c .d)? MDC said they’re dreadfully expensive, though they help much with readability of CSS code.

    I was thinking about writing a patch for Stylus that would mangle nested selectors, like this:

    .photos
    .photo
    .description

    ->

    .photos {}
    .photos-photo {}
    .photos-photo-description {}

    /* instead of */

    .photos {}
    .photos .photo {}
    .photos .photo .description {}

    but that was before opera & webkit implemented profiling, so I wasn’t been able to test them correctly.

  3. Gravatar

    Chris said on Jan 4, 2012 @ 13:14

    Very interesting to read. Shows how important it is that we get complete profilers. I doubt a bit that Opera is really slower in selector matching though. We have tested e.g. the selector matching in Dragonfly with selector-pattern-matching-performance before we have had the profiler and that is clearly quicker here in Opera than in Chrome.

  4. Gravatar

    Jos Hirth said on Jan 4, 2012 @ 15:56

    Quoted attribute values vs. unquoted ones (e.g. [type=search] vs [type="search"]). How does this affect performance of selector matching?

    The spec says:

    Attribute values must be CSS identifiers or strings.

    Use quotes. Consistency is more important than a potential 1msec gain. (I don’t expect that there is any difference.)

    A minifier (or some other kind of automated process) could remove quotes if they aren’t required.

    Also, the performance of text-shadow depends on the size of the affected area and the blur radius. For example if you give html an inset box shadow with a very large radius (like 300px), it will take bloody ages to render.

    I use the star filter for targeting IE7 (e.g. *zoom:1;). CSS properties can’t start with a ‘*’. There will never be a collision. It’s fine, really.

    Perhaps in the future tools like SASS could optimize declarations like these out of the main file and into conditionally-included ones.

    Some sort of media query perhaps? @media (-sass-export: ie7) {zoom: 1;} or something like that.

  5. Gravatar

    Joe Crawford said on Jan 4, 2012 @ 16:42

    Great exploration. Thanks much for sharing this.

    I hope all the browser developer tools adopt similar tooling.

  6. Gravatar

    Nico said on Jan 4, 2012 @ 21:50

    Great work, worth reading! I’m looking forward for a second part and more experiments.

  7. Gravatar

    Adam said on Jan 4, 2012 @ 21:51

    Interesting read. Thanks for sharing.

    @Nicholas, glad to see you are on this thread and happy to hear you will be taking this stuff into consideration for CSS Lint.

  8. Gravatar

    丸子 said on Jan 4, 2012 @ 22:33

    the day before yestoday,i did a research about the performance of the * selector in Chrome using the Timeline tab,it seemed to turn out that the * did not affect the performance in Chrome,i think there must be something wrong in my research,so i’ll test it again,is there any tool that helps us to do some research in IE or Firefox?hope someone can answer me

  9. Gravatar

    Julie Ng said on Jan 5, 2012 @ 5:29

    Great read with some surprising information, esp. the bit about border radius repaints taking longest to render, since it’s probably the most used of the css3 properties, having been around longer.

    Cheers!

  10. Gravatar

    Theodor said on Jan 5, 2012 @ 5:38

    Thanks fo the great article. I’m not able to see the css-profiling in chrome yet – do you know to enable it, if it is already possible?

  11. Gravatar

    Frank said on Jan 5, 2012 @ 6:12

    Great post, thanks for the stats and hint about this topic.
    Profiling is alqays in my focus, but this result is very helpfull.

  12. Gravatar

    pawel said on Jan 5, 2012 @ 6:15

    Maybe you’re right that Chrome only render visible areas. I tested a SVG -Sprite.
    Zoom in Chrome with Strg++ will show a sharpen image,but not in Opera and Firefox.
    I hope, the vendors will read yout tests, too and improve the performance. Great job!

  13. Gravatar

    Catalin said on Jan 5, 2012 @ 7:43

    I think this definitely worth reading and I really appreciate your efforts.

    Also, using CSS background-attachment:fixed declaration on Chrome is another thing (actually a bug) that slows down a page when scrolling. Hope I’m not missing something and here’s more info: http://code.google.com/p/chromium/issues/detail?id=18537

  14. Gravatar

    Paul Irish said on Jan 5, 2012 @ 12:25

    Very fine work!

    I alerted Antti Koivisto to this article so he can chime in if anything looks out of place regarding WebKit..

    Also filed a ticket against Compass for the IE-specific optimization you recommended: #644: optimize IE-specific rules by placing them into an IE specific sheet?

  15. Gravatar

    Philip Walton said on Jan 5, 2012 @ 12:44

    @kangax What did you do with your setup to get a “hits” column? I only see “Total” and “Matches” on Chrome 18.0.997.0 on Mac. I also don’t see the CSS icon with the dot above it in the bottom toolbar. Did you run Chrome with a specific command line flag?

  16. Gravatar

    tomByrer said on Jan 5, 2012 @ 20:39

    Thanks for the great tips on optimizing CSS!

    I was inspired by this article to open a request at SASS’s GitHub: https://github.com/nex3/sass/issues/241

    I just noticed Paul Irish has done the same with Compass (I had the request in my mental to-do since last night). Perhaps Sass would be a better engine to do this, since a new feature in Sass allows replacements; search for “Placeholder Selectors” here: https://github.com/nex3/sass/blame/master/doc-src/SASS_CHANGELOG.md
    Just file-splitting (only @import joining) is not integrated into Sass yet.

    cheers!

  17. Gravatar

    Gaurav said on Jan 6, 2012 @ 1:53

    This is incredible stuff. \m/_

    But also new area for the client to ponder over, who take css’s performance issues very critically.

  18. Gravatar

    Robert said on Jan 6, 2012 @ 4:20

    Do you now what self time http://clip2net.com/s/1sA2s means in Opera style profiler? I noticed that self-time value isn’t affected by multiple page refreshes like first value does.

  19. Gravatar

    Sebastian Blum said on Jan 6, 2012 @ 5:55

    Thank you for the great article.

    I think about using one css file for every page type. Is it better to speed up the performance by reducing unused selectors or is it besser to use one cached css file?
    greetings from munich, germany
    Sebastian

  20. Gravatar

    c69 said on Jan 6, 2012 @ 7:25

    This is huge! Thanx, man. Though, there are more open questions left:

    - How slow is background-sizing ? (it looks extremely slow)
    - Is there penalty for using multiple backgrounds ? or no ?
    - Are data-uri backgrounds faster, slower, or equal to their traditional counterparts ?
    - Performance of similar 2D vs 3D transforms (the latter are said to be HW accelerated in webkit, and thus faster).
    - Impact of position:fixed on scrolling performance in different browsers (neglectible in webkit, fresh mozilla, high in opera)
    - Impact of semi-transparent backgrounds on scrolling performance ? (no browser is able to handle this, yet. Neither Opera 12′s HWA, nor WebKit’s caching helps it)
    - How big is performance hit when using partial attribute match ([attr*="substr"]) selector ?
    - CSS transitions vs animations – who is faster for similar tasks ?

    and maybe:
    - Is it reasonable to use background-position js-animation (but what alternative we have – animated gif or css animations ?)
    - Should developers avoid accidentally triggering unnecessary reflows, by changing descendants of floated elements ? ( like it was described in http://chikuyonok.ru/2010/11/optimization-story/) or should Opera optimize it’s engine like mozilla and chrome did already ?

  21. Gravatar

    Toby Mole said on Jan 7, 2012 @ 11:18

    Great work and a good read! +1!

  22. Gravatar

    Gunnar Bittersmann said on Jan 7, 2012 @ 12:48

    Thanks for sharing your test results.

    AFAIS, this means
    (1) better use child selectors (combinators in CSS 3 speech) foo>bar whenever possible, not descendant selectors foo bar because the engine has to go from bar just one node up in the tree to check if it matches foo,

    (2) better use foo.quz whenever possible, not just .quz which is equivalent to *[class~="quz"] (universal selctor + attribute selector).

  23. Gravatar

    Robert said on Jan 7, 2012 @ 12:55

    better use child selectors (combinators in CSS 3 speech) foo>bar whenever possible, not descendant selectors foo bar because the engine has to go from bar just one node up in the tree to check if it matches foo,

    Gunnar Bittersmann, which browser engines works as you described?

  24. Gravatar

    Robert said on Jan 7, 2012 @ 12:59

    Gunnar Bittersmann, and the same question for second statement, maybe you have some performance test results?

  25. Gravatar

    pomeh said on Jan 7, 2012 @ 13:49

    This post is awesome, well writed and good content. CSS profiling is very interesting but we don’t have much content to dive in for now.
    It would be nice to have something like jsperf but for CSS, where we could easily test differents snippets on all browsers and follow their evolution (improvements and regression) ! I’ll try to look if I can make a prototype for it ;)

    Also, this brings me somes questions about CSS rules parsing procedure. We known it’s parsed from right to left, but in some cases the top most left selector only target a fews browers/cases (IE classes names, Modernizr classes). So here, what are the advantages of parsing the left selector last ? If one could detect the “.ie7″/”.input-placeholder” is not present at all in any elements, we could avoid some extra work and boost the selector performance ! I really want to know what one think about this, and explain me why and how I’m right or wrong.

    Cheers

  26. Gravatar

    Gunnar Bittersmann said on Jan 7, 2012 @ 13:59

    @Robert:
    (1) kangax has metioned right-left matching: processing foo bar, the enginge checks for each bar element if it has an ancestor foo element, that might mean climbing up the tree to the very root node. Processing foo>bar, the engine checks for each bar element if its parent element is of type foo, that means climbing up the tree just one level.

    (2) kangax said, In both Opera and WebKit, [type="..."] selectors seem to be more expensive than input[type="..."]. Probably due to browsers limiting attribute check to elements of specified tag (after all, [type="..."] IS a universal selector).
    The same should apply to [class~="quz"] vs. foo[class~="quz"], i.e. to .quz vs. foo.quz, shouldn’t it?

    However, the linked to MDN article says: Don’t qualify Class Rules with tag names.
    Now I’m confused. Do engines treat classes different that other attributes?

  27. Gravatar

    @ommunist said on Jan 7, 2012 @ 14:47

    Thank you very much for pointing to the new dev tools, and for raising the topic. Although I do not believe that IE will ever follow standards, I have to keep it in mind and the question is how to measure CSS rendering in IEs if I use filter sets for visual compatibility, like CSS Pie?

  28. Gravatar

    kangax (article author) said on Jan 7, 2012 @ 15:49

    @Nicholas Thanks, and glad to hear some of these might make it to CSS Lint. I forgot to mention it in the post, but I actually used CSS Lint at the beginning stages of CSS optimizations, before I started looking into property/selector performance. Definitely found few low-hanging fruits with it :)

    @Paul Miller Yes, .a .b .c .d did appear to be on the expensive side. Automatic replacement of .foo .bar to .foo-bar sounds great, although there’s certainly a lot of underwater rocks there — specificity, finding all the places where they’re used (in HTML and JS), etc. IIRC, some tools, like GWT do something similar — they change class names to shorter ones — to reduce overall document size.

    @Jos Hirth Yes, of course. Common sense dictates that most properties with values (shadows, gradients, border-radius) should degrade in performance as the size increases. Drawing 5px shadow is probably less expensive than drawing 20px shadow. Media query for SASS is a good idea. Something similar is proposed here, by the way.

    @丸子 The documents I tested definitely showed * among first few slowest selectors in WebKit. Not sure about Chrome, as I didn’t check profiler in it.

    @Theodor The profiler should be available in Chrome Canary as of now. You can enable it via this flag.

    @Paul Irish, tomByrer Thanks guys for getting the ball rolling on that SASS/Compass idea :)

    @Philip Walton I only checked profiler in WebKit, not Chrome Canary. Perhaps they modified it a little or didn’t port certain features?

    @Robert Good point about self-time values. I’m not sure what they mean. And Opera’s blog post on profiler doesn’t seem to mention this. I did notice that self-time of “Paint” and “Layout” events is usually identical to the “other” time values of those events. Yet, for document/script/css parsing the values of time and self-time are very different. Perhaps document/CSS parsing total time also includes time of style recalculations and/or layout/paint events?

    @Sebastian Blum It all depends on a context. I would prefer caching, unless we’re talking about very complex document (at least 1000 nodes). In that case reducing CSS rules could be better overall — if you care about increasing perceived page performance (scrolling/animations) as much as possible.

    @c69 All good questions! I’d love to see them answered too :)

    @pomeh Yes, determining if elements with .ie7 class exists on a page would be huge for performance of complex selectors like .ie7 .foo .bar > * since it would avoid so much work. It looks like some engines (e.g. WebKit) have started working on optimizing these cases, so perhaps we’ll see much better performance in the near future.

    @Gunnar Bittersmann Good point about qualifying universal selectors. I also noticed this contradiction. It might be that engines treat classes differently; possibly creating some kind of fast-access hash table for elements containing them. This would make sense, considering that class selectors are probably among the most used ones (if not THE most used ones). So accessing elements by .foo must be triggering some kind of fast-path matching. And accessing them by foo.bar has to perform additional check of each of the elements’ tagName. This is just my speculation, of course, but it reminds me of certain JS optimizations in current engines, where something like if (a.b) { } is often marginally faster than if ("b" in a) { } due to optimizations of first pattern (you can imagine that it’s very popular).

  29. Gravatar

    Matt said on Jan 9, 2012 @ 1:15

    I wonder whether the performance of border-radius is better or worse than the use of a background-image. Usually, when someone says we have to use background images as a fallback for border-radius in older browsers, I refuse to by argueing this would slow down the slow browsers even more. Now with CSS profiling we could see the real numbers.

  30. Gravatar

    Tom said on Jan 10, 2012 @ 9:05

    Hey there,

    how did you get an exact breakdown of each property? I am unable to find it neither in the opera profiler nor in the chrome canary profiler. Or did you do them yourself by comparing rendering times?
    Please give a hint, I don’t get it …

  31. Gravatar

    Kail said on Jan 12, 2012 @ 1:26

    Great article!

    I just don’t understand how could selectors with multiple classes (.class1.class2) is much worse than tag selectors (.class1 a).

  32. Gravatar

    zcorpan said on Jan 12, 2012 @ 3:04

    Quoted attribute values vs. unquoted ones (e.g. [type=search] vs [type="search"]). How does this affect performance of selector matching?

    It shouldn’t affect selector matching at all. It should only affect performance of CSS parsing, but I imagine the difference is negligible.

  33. Gravatar

    元彦 said on Jan 12, 2012 @ 4:52

    in my test,Opera style profiler’s data looks not very useful

  34. Gravatar

    Viorel said on Jan 16, 2012 @ 3:25

    Excellent article! Thanks for the great insight!

  35. Gravatar

    Dmitry Pashkevich said on Jan 16, 2012 @ 11:47

    Thanks for such an amazing article! Really learned something new, more than people usually write in “CSS Performance Best Practices” – kind of articles!

    I would like to add that while box-shadow (and less, text-shadow) may not be the least performant in load time, it has the highest impact (AFAIK) on relayout (is it the same as reflow?) – that is when you have animation that moves around an element with a shadow. I suggest specifying in some places of the article what kind of performance are you talking about so some people get less confused.

    Thanks again for the article! +1′ed and clipped to evernote! :)

  36. Gravatar

    Moritz Zimmer said on Jan 23, 2012 @ 3:26

    Thanks a lot for all the work; I’m quiet sure !important has an impact, as the parser needs to look ahead and back in the tree.

  37. Gravatar

    anon said on Jan 31, 2012 @ 3:43

    Just wanna say that OP 11.60 is 100% green (YES) on this page: http://kangax.github.com/es5-compat-table/

  38. Gravatar

    Ray Cromwell said on Jan 31, 2012 @ 11:13

    Just as a note, Google has been shipping a tool for 2 years that does aggressive browser profiling (http://code.google.com/webtoolkit/speedtracer/) with a nice UI for locating and filtering reflows, event handling, css matching, etc. It also allows export/sharing of any profile so others can look at the same thing you are.

  39. Gravatar

    debugwand said on Feb 3, 2012 @ 6:07

    So while engines normally work from right to left, is this not true for attribute selectors?

    E.g.
    input.myclass gets everything with class myclass, then filters that result to get only inputs. Therefore it is slower than .myclass, which has no further recursion.

    Were input[type=checkbox] to follow this rule, it would be slower than [type=checkbox]

  40. Gravatar

    Dmitry Pashkevich said on Feb 3, 2012 @ 6:24

    debugwand, while generally what you said is true, I think modern browsers perform numerous optimisations, for example [type=checkbox] is only applicable to input elements. The browser can also classify your CSS rules by tag type after parsing the stylesheet, that way it would be able to skip the entire set of rules specified for input tags if it encounters, say, a div element. Unfortunately I can’t remember where I read about this so I might misrepresent something.

  41. Gravatar

    fotovoltaika said on Mar 12, 2012 @ 11:45

    Wow, how do you remember all this infos? You must work lot of hours, really expert on what you do! I must “study” this page 2-3 days to do that.

  42. Gravatar

    Rina Noronha said on Mar 14, 2012 @ 12:16

    Hi!

    I’m the web editor at iMasters, one of the largest developer communities in Brazil. I´d like to talk to you about republishing your article at our site. Can you contact me at rina.noronha@imasters.com.br?

    Bests,
    Rina Noronha
    Journalist – web editor
    http://www.imasters.com.br
    redacao@imasters.com.br
    rina.noronha@imasters.com.br
    +55 27 3327-0320 / +55 27 9973-0700

  43. Gravatar

    Bob Myers said on Sep 5, 2012 @ 4:23

    Is it known what the impact of !important is, if any, on performance? Is it possible that by short-circuiting parts of the cascade it could improve performance?

  44. Gravatar

    sf said on Oct 19, 2012 @ 21:26

    Very detailed article, thanks. This part was confusing:

    WebKit was marginally faster [...] a ~65x difference.

    A 65x difference seems quite large. I think you may mean something like “drastically” faster, not “marginally“.

  45. Gravatar

    John Doe said on Oct 30, 2012 @ 7:47

    You sure seem to have a lot to say about css, for some one
    who hasn’t figured out the most basic of it’s usage. The
    side scrolling on this page is, well there shouldn’t be any.
    Yet there is.

  46. Gravatar

    nicomp said on Mar 7, 2013 @ 18:32

    I am a JavaScript Programmer: https://www.youtube.com/watch?v=_AYyKAOdnSM

  47. Gravatar

    T SUPONGWATI LONGKUMER said on Mar 15, 2013 @ 18:53

Trackbacks

  1. My Stream » CSS Profiling and Optimization said:

    [...] of selectors, universal selectors, border-radius, and transforms. Worth a thorough read through.Direct Link to Article — Permalink…CSS Profiling and Optimization is a post from CSS-TricksOriginally posted [...]

  2. CSS Profiling and Optimization | Qtiva said:

    [...] Just as I got done saying how I hope we can soon stop talking about CSS selector performance, Juriy Zaytsev publishes some great research on selector performance using Opera and WebKit’s new “style profiler” as part of the dev tools. He was able to save 650ms on page load time on a CSS3 heavy one-page app. Big difference makers: number of selectors, universal selectors, border-radius, and transforms. Worth a thorough read through Direct Link [...]

  3. → Perfection kills » Profiling CSS for fun and profit. Optimization notes. said:

    [...] gehobenere Kost für den Frontend-Entwickler von heute hat Juriy Zaytsev (kangax) veröffentlicht: Perfection kills » Profiling CSS for fun and profit. Optimization notes.. Er hat sich angeschaut, wie sich verschiedene CSS-Selektoren aber auch CSS-Eigenschaften, [...]

  4. Weekly #28 | fitml.com Blog said:

    [...] Profiling CSS for fun and profit. Optimization notes. – http://perfectionkills.com/profiling-css-for-fun-and-profit-optimization-notes/ [...]

  5. Friday Focus 01/06/12: Look Alive! | Devlounge said:

    [...] Optimization – Profiling CSS for fun and profit. Optimization notes. “As our pages/apps become more interactive, the complexity of CSS increases, and browsers [...]

  6. WebKitに新搭載(予定)!CSSプロファイルツールでCSSのチューニングをしよう | 3streamer blog said:

    [...] 今回は「Profiling CSS for fun and profit. Optimization notes.」という海外の記事からCSSのセレクタとパフォーマンスの話と、Webkitに新たに搭載される(予定の)CSS プロファイラーツールをご紹介します。 [...]

  7. Profiling CSS | Robert Accettura's Fun With Wordage said:

    [...] interesting research regarding CSS and performance that any web developer should read. Nothing really groundbreaking but it’s good to see the [...]

  8. Rounded Corners 318 – Legacy browsers /by @assaf said:

    [...] Stylish Profiling CSS. Stuff I didn’t know and a nice preview of Opera’a CSS profile, soon to be re-imagined in WebKit. [...]

  9. Friday Focus 01/06/12: Look Alive! said:

    [...] Optimization – Profiling CSS for fun and profit. Optimization notes. “As our pages/apps become more interactive, the complexity of CSS increases, and browsers [...]

  10. CSS Profiling and Optimization | 13fqcs said:

    [...] Direct Link to Article — Permalink [...]

  11. Revision 54: Ein Sack voll Firefox, lahmes CSS und Media Queries | Working Draft said:

    [...] [00:40:33] Profiling CSS for fun and profit. Optimization notes. [...]

  12. Web Design Weekly #26 | Web Design Weekly said:

    [...] Profiling CSS for fun and profit. Optimization notes (perfectionkills.com) [...]

  13. Weekly Favorite from the Web No.003 | Articles said:

    [...] the impact of CSS3 features on the performance of a website, and how you can optimize it. Go to the source »iPhone 4S purely with CSS3Well, not only it is pure CSS3 but it is also pure awesomeness. Go to the [...]

  14. Web excursions: January 4, 2012 - January 15, 2012 - Brett Terpstra said:

    [...] 15, 2012 (1 min ago)LinksLinks of interest from January 4, 2012 through January 15, 2012:Profiling CSS for fun and profit. Optimization notes.Some interesting results from testing and profiling browser performance with CSS3 properties and [...]

  15. David Kaneda @ DevCon5 NYC | Software Walker said:

    [...] * Use CSS to give yourself various fallback positions for fonts, backgrounds [but beware the performance hit of fancy CSS]. [...]

  16. 通用选择符“ * ”与前端的“矫情” | html5集中营 said:

    [...] 参考资料:http://perfectionkills.com/profiling-css-for-fun-and-profit-optimization-notes/ [...]

  17. Which CSS selectors or rules can significantly effect front-end layout / rendering performance in the real world? - feed99 said:

    [...] perfection kills blog post suggested that border-radius and box-shadow rendered orders of magnitude slower than simpler CSS [...]

  18. Highlights of Week 02/2012 « Michael Gaigg: Über UI/UX Design said:

    [...] Profiling CSS for fun and profit. Optimization notes (by kangax) [...]

  19. Velocity Newsletter: January 19, 2012 - O'Reilly Radar said:

    [...] website. He points to a “great article about CSS performance optimizations,” titled Profiling CSS for fun and profit. Optimization notes in which kangax asks perhaps the ultimate question: “I could see by scrolling and animations [...]

  20. 复杂应用的 CSS 性能分析和优化建议 | Z.J.T Blog said:

    [...] 译自:Profiling CSS for fun and profit. Optimization notes. [...]

  21. Revision 105: CSS-Performance, Web Workers und ein paar Links | Working Draft said:

    [...] erfahren, ob Sprites oder das Inlining von Bildern besser sind (Inlining gewinnt). Wir befinden die CSS Profiler von Dragonfly und Chrome für gut, CSS Lint ob zu strenger Regeln für weniger gut. Das DOM zu [...]

  22. Performance Optimization for Cascading Style Sheets ← LoadStorm said:

    [...] however, CSS optimization will be required. Juriy Zaytsev (“kangax”) provides an in-depth example of one such case, complete with profiling data. He provides a few additional rules for optimization, [...]

  23. Google Chrome Developer Tools | JaWAB said:

    [...] Profiling CSS for fun and profit. Optimization notes. [...]

  24. RWD Summit 2013 Presentations - Adapdevelopment - Adapdevelopment said:

    [...] Profiling CSS for Fun & Profit [...]

Leave a Comment

Please, don't forget to escape your input (<, > and &). Wrap code sections with <pre>

Allowed tags: <a href="" title=""> <abbr title=""> <acronym title=""> <b> <blockquote cite=""> <cite> <code> <del datetime=""> <em> <i> <q cite=""> <strike> <strong>