How do you rank in your CrossFit box?
I've always wanted to know where I stand at my gym — not just today, on one or two workouts, but over years.
As you might know, I've been on a mission to create the best CrossFit app. This made me research a lot of the existing ones: SugarWOD, PushPress, and Wodify all show a daily leaderboard1. You do Fran, you see how you placed against whoever also did Fran that day. Fun for about ten seconds. Well, some of us are nuts competitive. We want rankings that represent overall fitness, which means aggregating many scores.
I decided to find out.
Getting the data
My first idea was gloriously dumb: point Claude at the SugarWOD app on my phone and have it scroll through leaderboards, screenshotting ranks one by one. Slow, fragile, but that's ok because an agent can chew through it in the background.
Opus surprised me with a better idea. SugarWOD's own web app talks to an internal API. Using my authenticated SugarWOD session, I could retrieve the gym results already available to me as a member. No screenshots and much faster. Claude knew this because I've experimented with some of the SugarWOD API to create a whiteboard in PRzilla.
So I pulled all of our gym's (Murder of Crows) data. Men, women, RX, scaled. Every recorded score from November 14, 2017—the month my gym started logging—through July 20, 2026. 103 active months. Roughly 640 athletes. 117,236 individual scores. An absolute goldmine of performance data and athlete rankings.
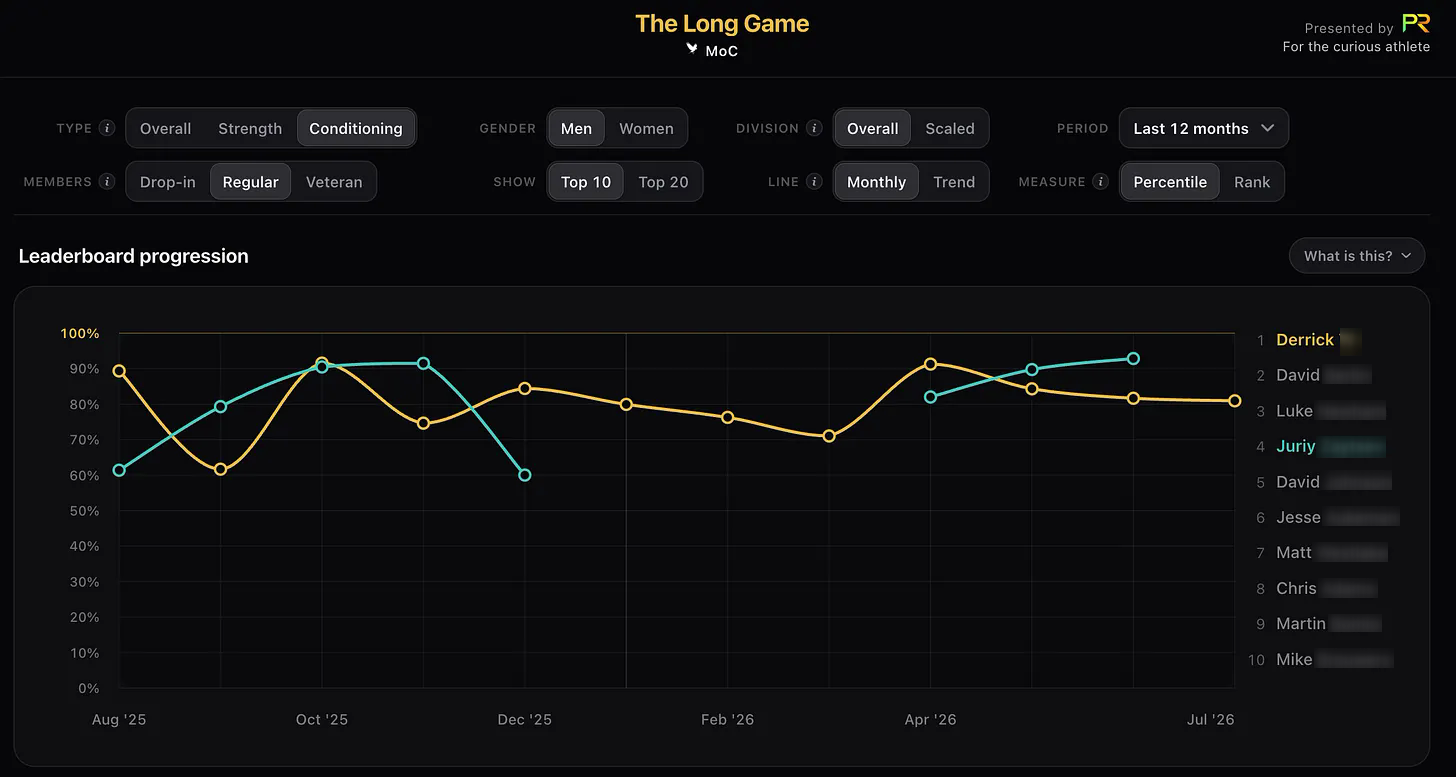
I thought I was building a chart for an afternoon. A week of ruthless iteration later—questioning every number, removing more than I added, and simplifying it again and again—I had a clear view of nearly nine years of athlete progress.
You can play around with an anonymized version at https://przilla.app/moc. The public board uses stable aliases, while gym members have a private link that shows real names.
Click any dot to see the workouts behind that month.
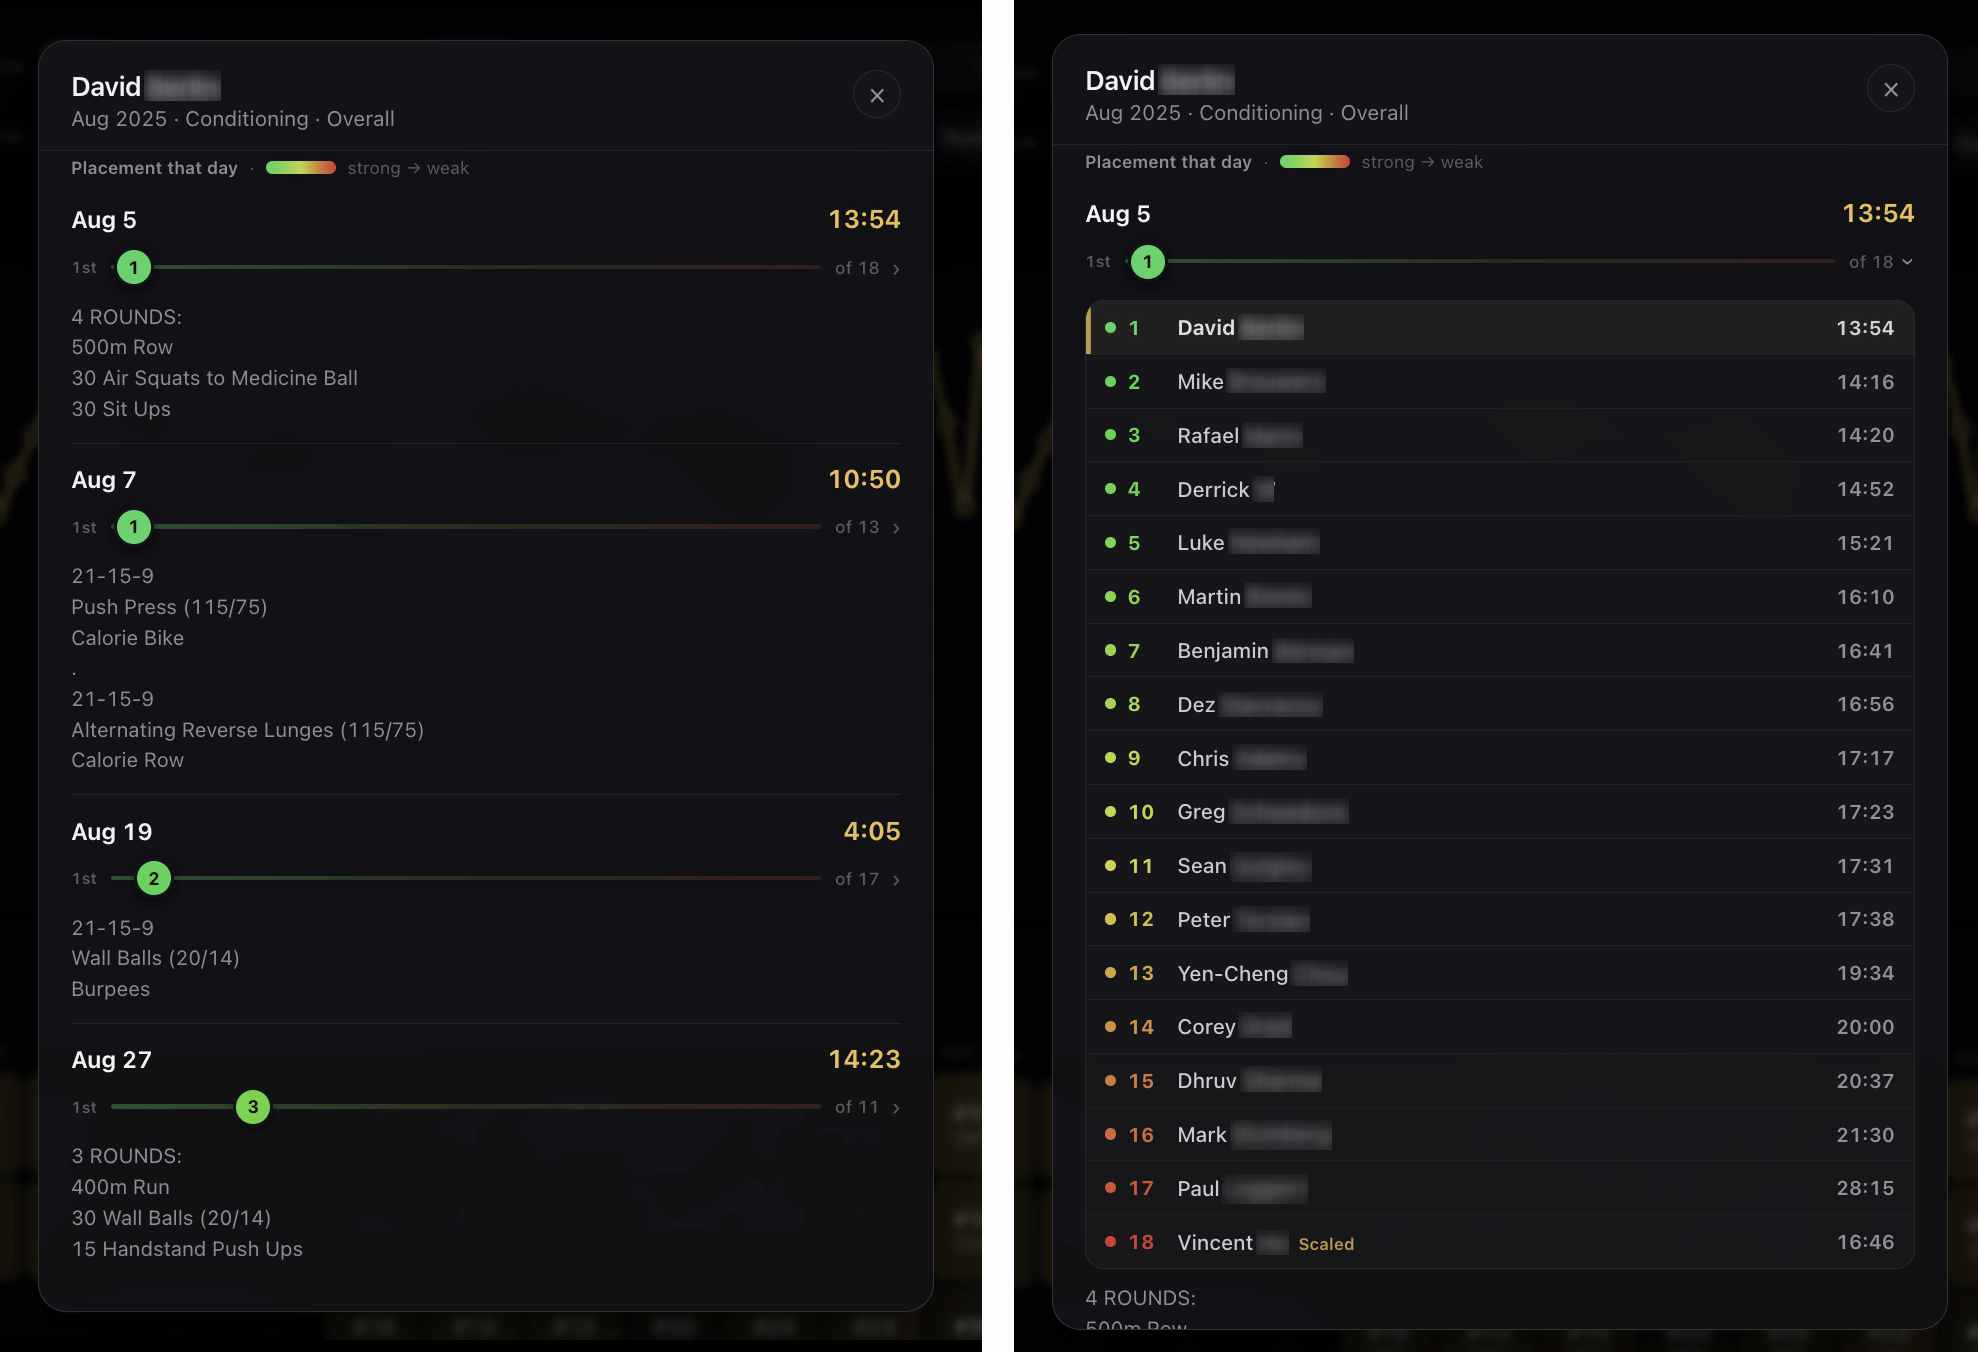
The Rx and Scaled problem
At first I split everyone cleanly: Rx on one board, Scaled on another. Seemed fair. Then I noticed what that hides. If one athlete does a workout Rx while twelve others scale it, the Rx board calls that athlete first out of one—a meaningless win. And no combined board gives them credit for attempting the prescribed version.
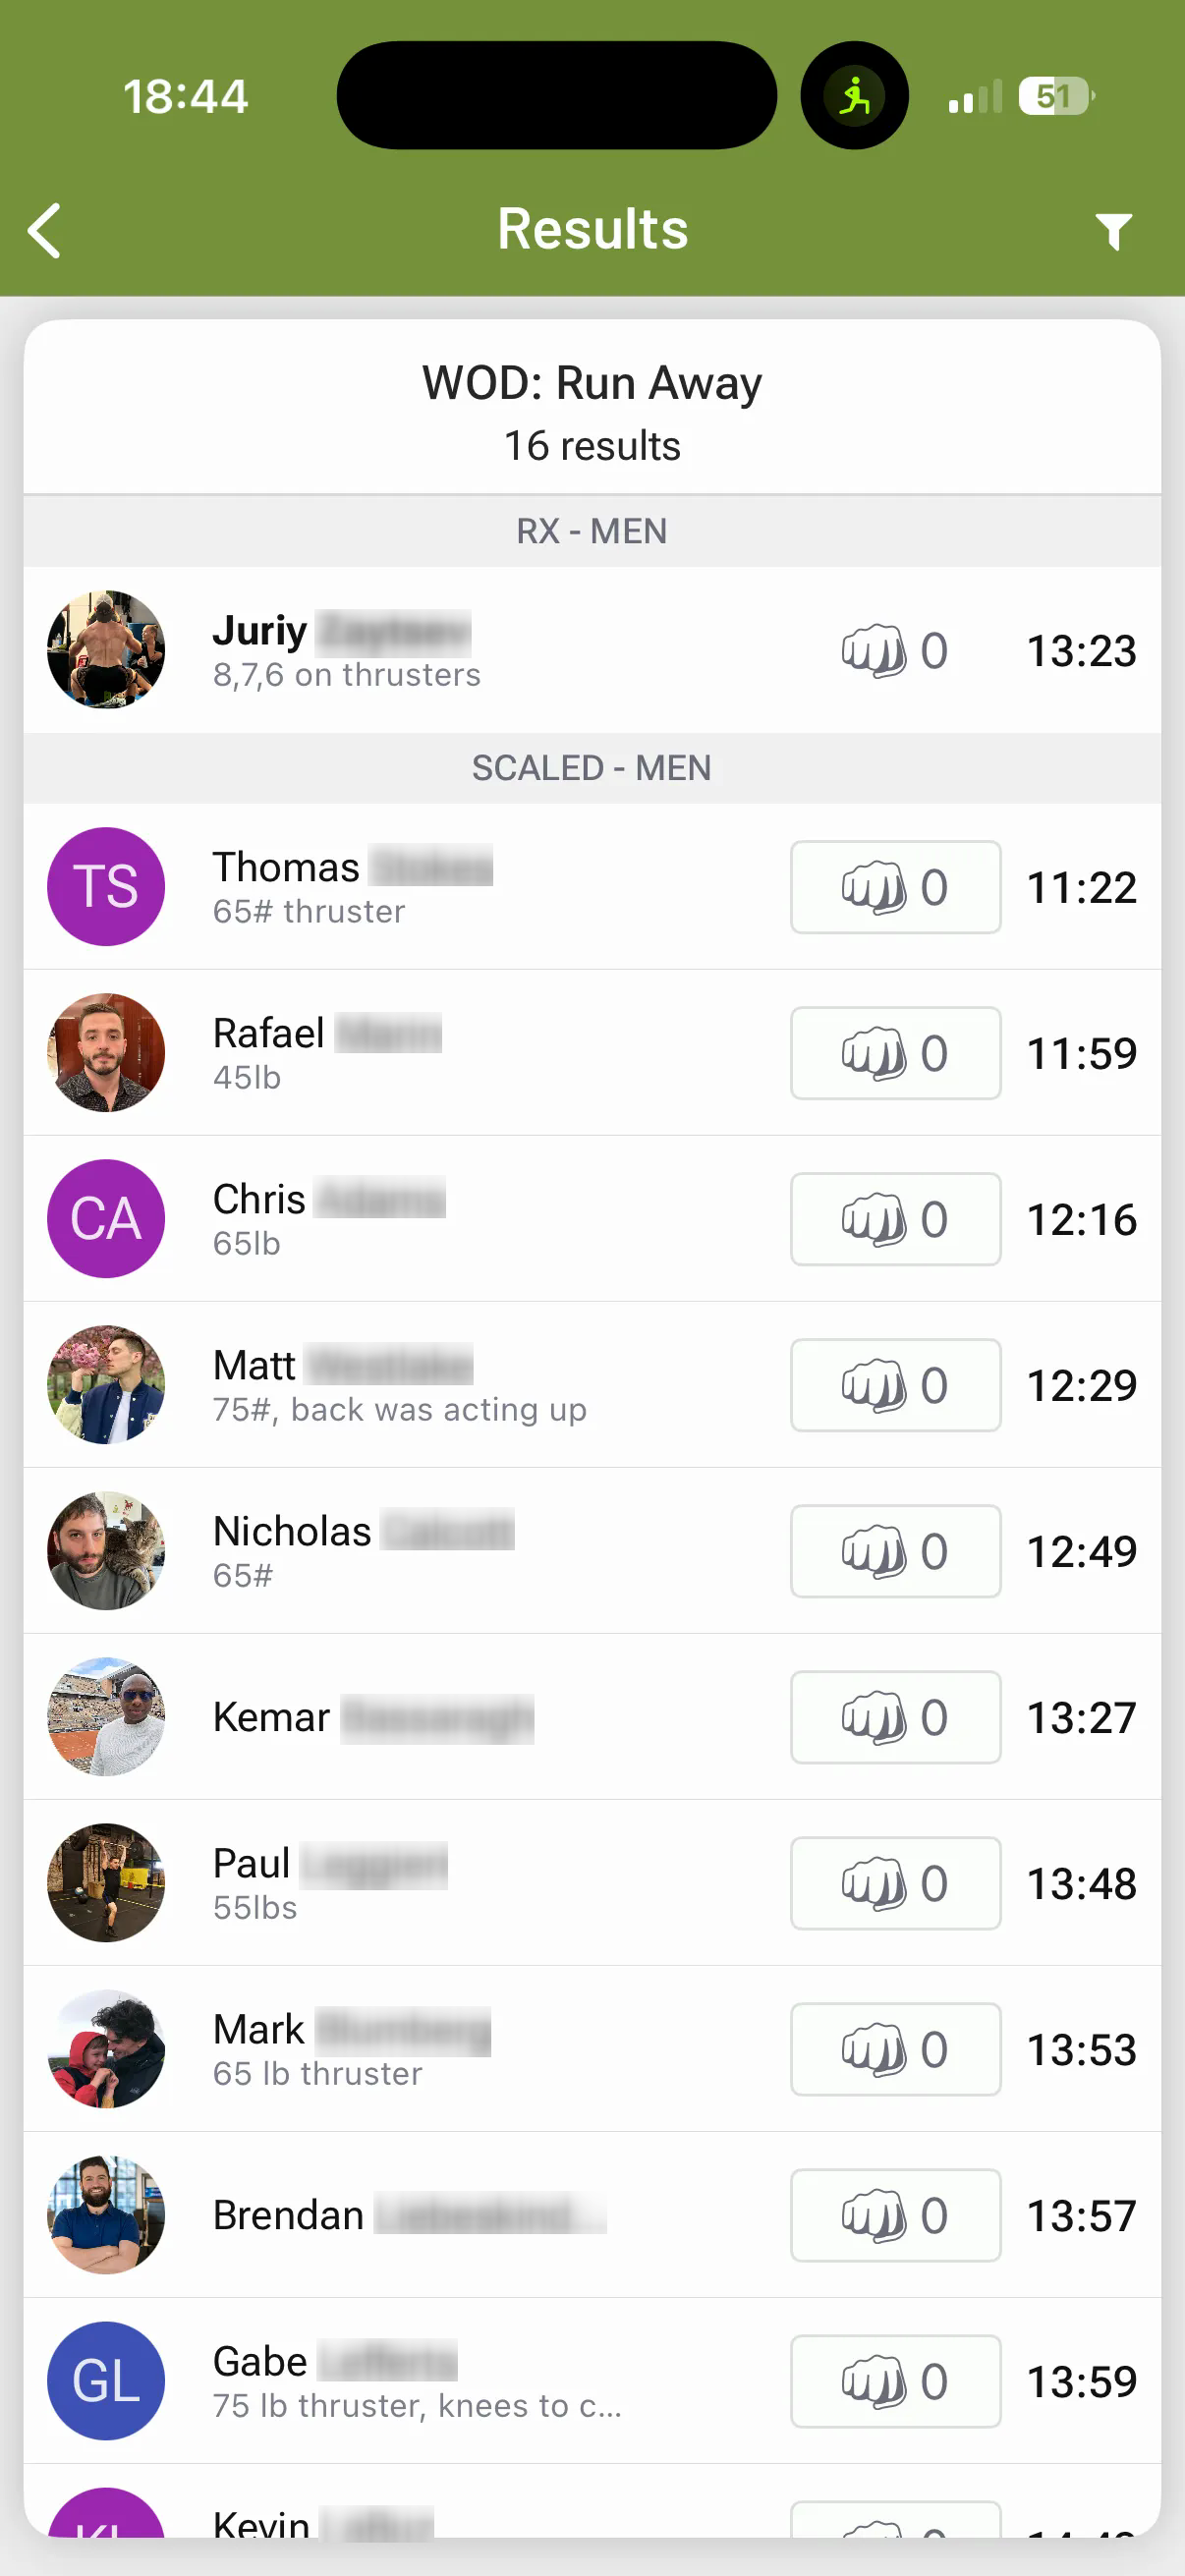
So I added a third view, "Overall." For this experiment, I used a simple, transparent Open-style rule: every Rx result ranks above every Scaled result; within each group, results are sorted by score.
Here's why it matters. Say five people go Rx and you land third. Ten more go Scaled, below all the Rx. On the old Rx-only board you're third of five — middle of the pack. In Overall you're third of fifteen, ahead of everyone who scaled. You go from roughly the 50th percentile to the top 20%.
Another fascinating problem: ~66% of the conditioning scores in my gym's history are scaled—39,556 of 59,743. You might scale Fran to 65 pounds and banded pull-ups while I use 95 pounds and jumping pull-ups, yet both results appear simply as "Scaled, 4:12"—despite representing very different workouts.
Most apps don't truly know how you scaled. SugarWOD saves a score and a note like "65#"; PRzilla records the movements and loads, so it knows you did jumping pull-ups and 65-pound thrusters. That gives us better inputs—65 pounds is 68% of Fran's prescribed thruster load—but it still cannot fairly compare different substitutions, loads, and finish times. This historical dataset does not contain enough detail to reconstruct them.
What about 80% of the prescribed load at 5:05 versus 60% at 4:05? One person did the harder version; the other was a minute faster. Is 20% more weight worth a minute? It depends on the workout and the athlete. Scaling also isn't linear: the difficulty gap between a 95 lb and 135 lb thruster isn't the same as that between 135 lb and 175 lb, despite the identical 40 lb difference. Performance can drop sharply as the load approaches an athlete's limit.
Why percent beats rank
Rank hides field size. Third of four means beating one person; third of forty means beating thirty-seven—about the 95th percentile. Percentile puts both results on the same scale, letting us compare performance across days, months, and years.
Does doing more WODs hurt you?
Once every result was normalized and every scored day got one vote, Derrick remained first in almost every version. Across the monthly athlete records, WOD count and Avg had a correlation of −0.05—no meaningful linear relationship.
Avg is still too trusting. An 80% Avg from 20 recorded days may reflect a lucky stretch; a 75% Avg across 200 days includes great, ordinary, and bad ones. Adjusted accounts for this by adding 30 imaginary middle-of-the-board days to everyone. Those days pull a short history toward the middle but barely affect a long one. Avg stays visible; Adjusted determines the ranking.
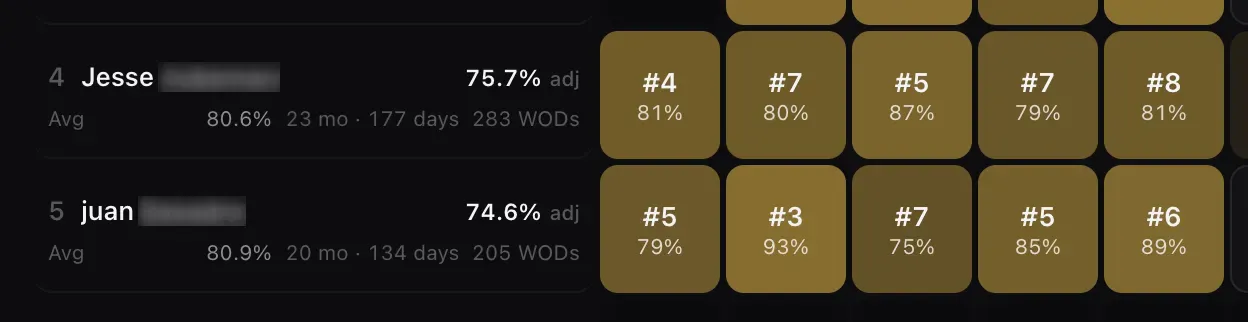
Over the same 24 months, Jesse averaged 80.6% and Juan 80.9%. After adjustment, Jesse leads 75.7% to 74.6%. Jesse had 177 scored days across 23 qualifying months and 283 scorecards; Juan had 134 days across 20 months and 205 scorecards. The adjustment uses scored days—not raw scorecard totals—because each day gets one vote.
In Overall, Strength and Conditioning are adjusted separately, then blended 50/50.
Consistency only determines who appears: Drop-ins need results in 20% of selected months, Regulars 50%, and Veterans 70%. It does not change anyone's score. Adjusted still sees only what someone recorded—which brings me to the uncomfortable part.
Self-selection bias
I cherry-pick. Not always on purpose, but I do it.
I'll happily throw down on a workout full of ring muscle-ups, handstand push-ups, and snatches — my stuff. And I will find a reason to skip the day it's thrusters, air bike for max cals, or sit-ups. (I hope I'm not the only one with Air Bike feelings). So my percentile is, let's be honest, a little inflated by which workouts I choose to enter.
Adjusted can account for how much history you have, but not what you chose to skip. Someone who logs every ugly WOD is measured more honestly than someone who curates. The number is real; it just isn't the whole truth.
King of the hill
I also added longer lenses—3 years, 5 years, and "All time"—to find the true king of the hill across nearly nine years of gym history.
Longer windows also reveal absurd lifetime volume. David has 1,312 conditioning scorecards; Mike has 1,336; I have 313. Across Strength and Conditioning, their totals rise to 2,124 and 2,238 recorded results, versus my 517. Standing next to that, my carefully curated percentile feels a little less heroic :)
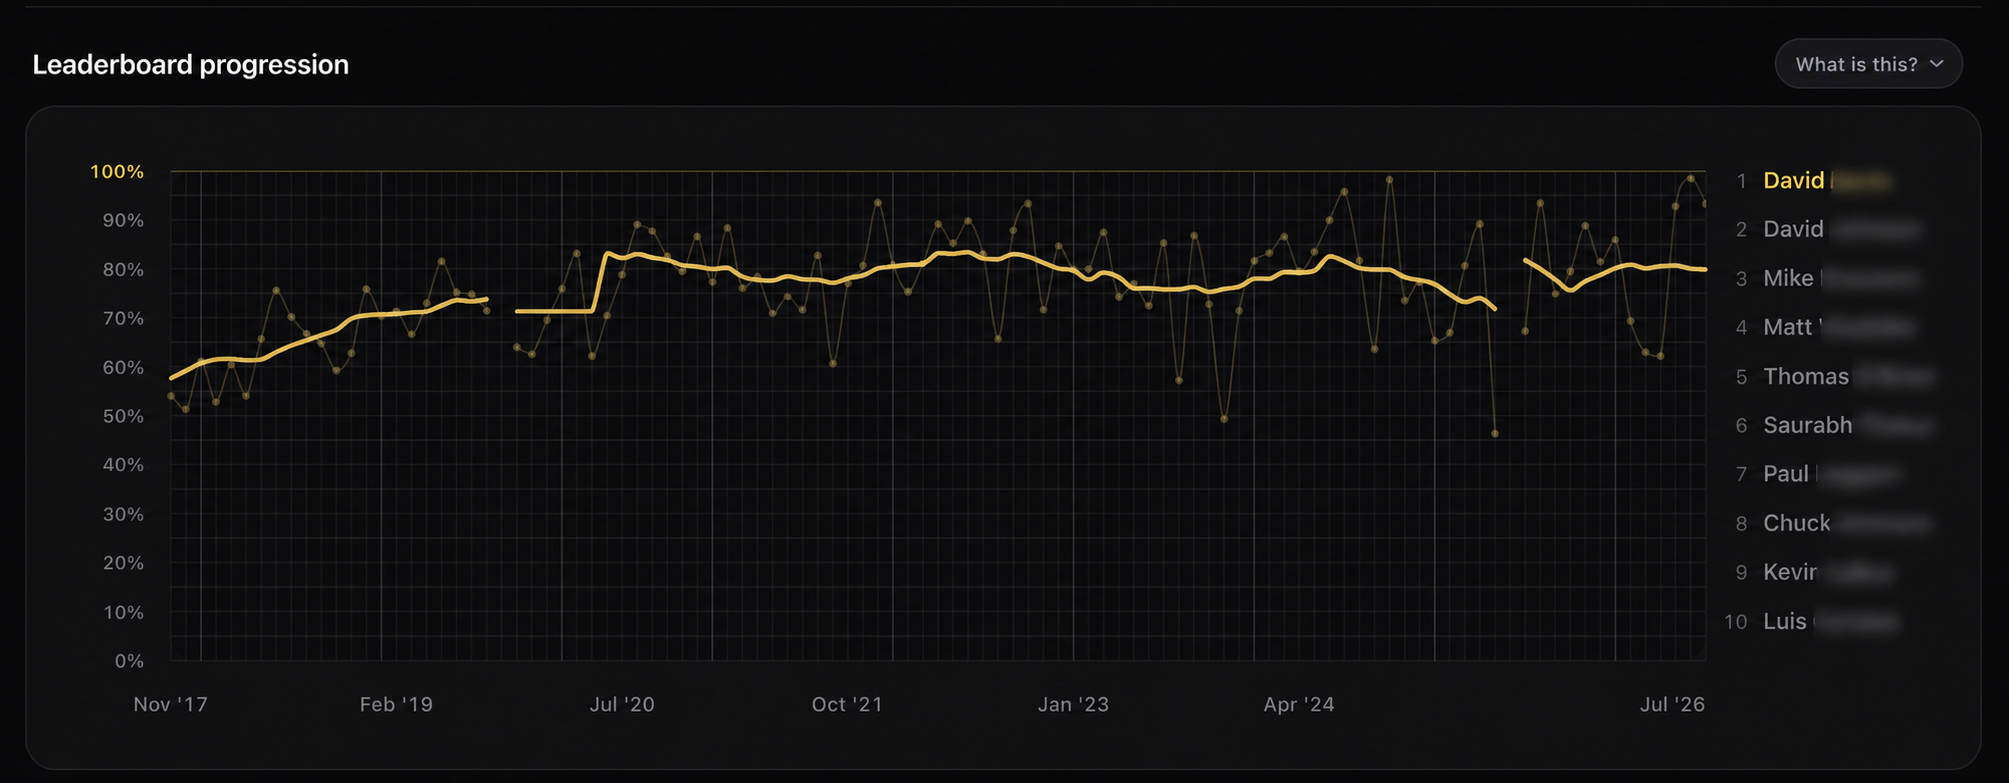
When you zoom out to 3 years, 5 years, or All time, monthly noise gets distracting. So the trend adapts to the selected range: it smooths over 7 months in the 3-year view, 11 months in the 5-year view, and 13 months in All time. Here you can see David's impressive rise from roughly 60% to 85% on the conditioning chart from 2017 to 2020, then holding near 80% for roughly the next six years.
Is the whole gym improving?
An 80th-percentile trend means you kept outperforming roughly 80% of the field; it does not measure fitness directly. Your times and weights can improve while your percentile stays flat if the gym improves too. And because participants change each month, it is never exactly the same field.
Age adds another twist. Performance often becomes harder to maintain as we get older, though the timing and rate differ for everyone. Holding the same absolute output from 35 to 40 can itself be meaningful progress against the expected curve. Staying flat relative to a younger or improving field may be impressive too—but percentile alone cannot prove it. For that, I would need repeated benchmarks or age-adjusted scoring.
The other half: absolute progress
Percentile tells me whether I'm climbing within the room. But the same workout data can reveal something more personal: whether my lifts are getting heavier, my benchmark times are getting faster, and my overall fitness is improving. That's the next gym chart I'm exploring.
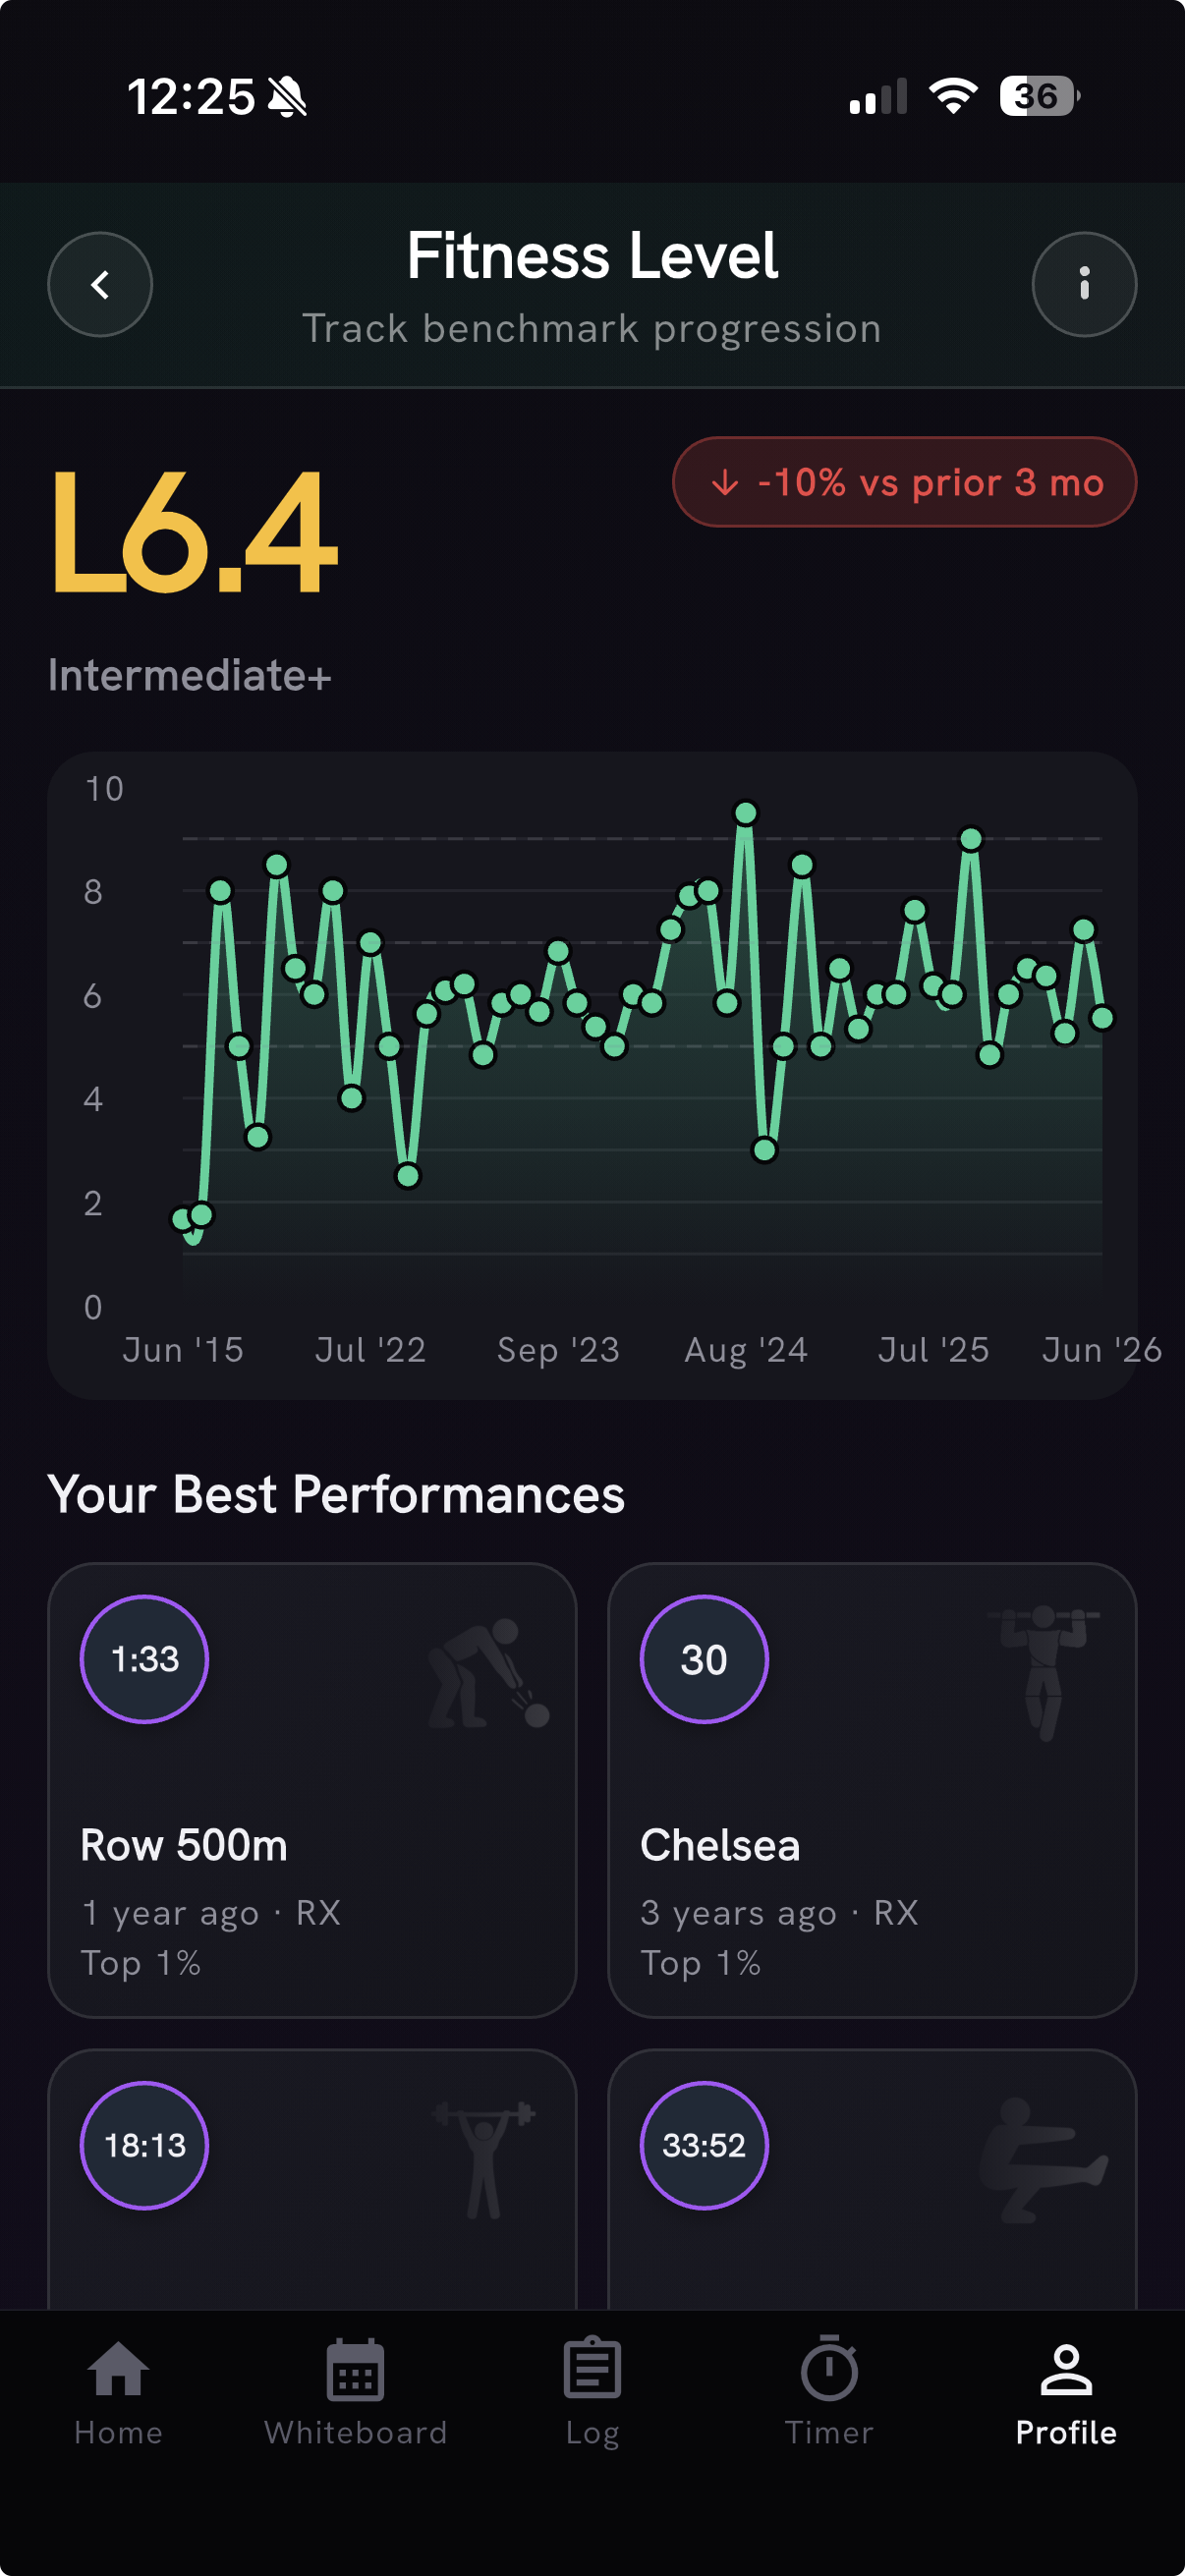
As an athlete, you can also use PRzilla :) and this was my intention with creating it in the first place: log a score, and it's automatically parsed, tracked, and turned into a picture of your absolute WOD performance over time:
If you run a gym and want this for your box, email me.
btwb gets closest, with all-time leaderboards per workout and a 'Fitness Level' percentile you can chart over time — but that percentile is against the whole btwb community, not your gym's room, and it's an aggregate fitness score, not your standing on the workouts you actually did.
Did you like this? Donations are welcome
comments powered by Disqus